← Back to home

Statistics

Updated on 2026-10-15

For:Musher guide

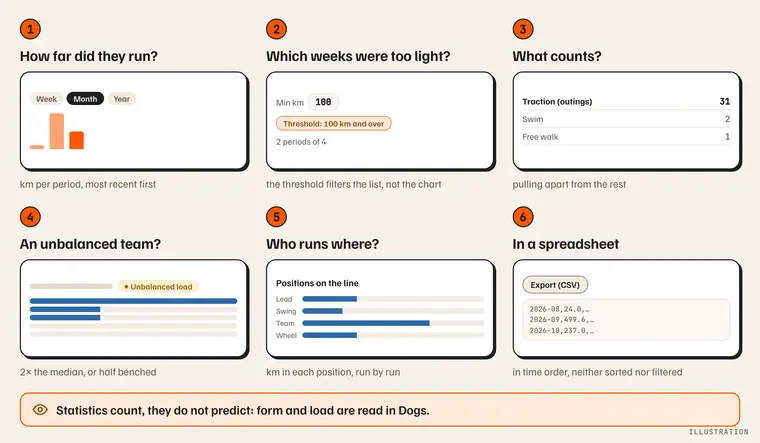
Map of the Statistics page in six questions: how far did my dogs run, which weeks were too light, what counts as pulling, is a team unbalanced, who runs where on the line, my figures in a spreadsheet; statistics count, form and load are read in Dogs. Illustration.

How far did my dogs run this month?

“Volume per period”: a chart, then one row per period, the most recent first.
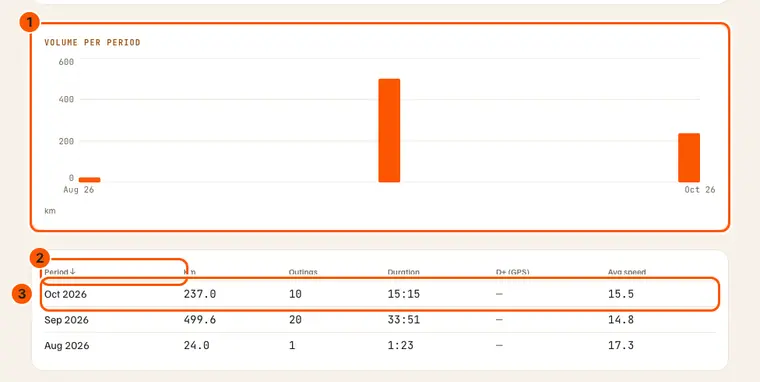
The “Volume per period” chart (1), the “Period ↓” header that sorts (2) and the current month, at the top of the list (3).

  • Where: Training › Stats on the site; Activity › Statistics on the phone. Absent from a breeding-only kennel, and from a Vet's menu.
  • Split: “Granularity” Week · Month · Year on the site (Month to start with); “Split by” on the phone. The whole history, races included, pulling only.
  • For whom: the team and dogs chosen at the top of the screen. With dogs chosen, an outing counts once, at the km of the farthest of them, stopped where it was taken off the line.
  • The list: km, outings, duration, D+ (GPS) — “—” when nothing is tracked, the tracked share otherwise —, average speed.
  • The chart is in time order, with only two axis marks; the list gives the detail.
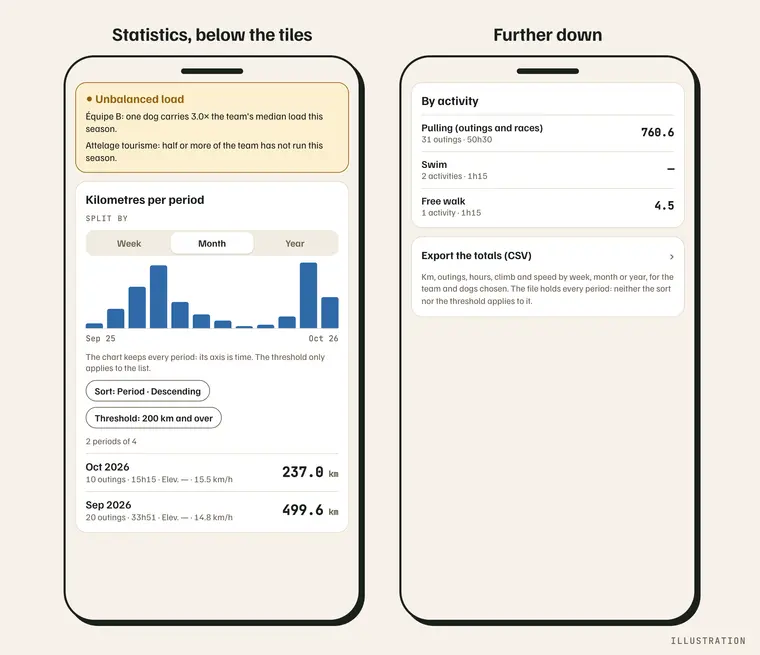
On the phone: the “Unbalanced load” banner, then “Kilometres per period” — Split by, chart, “Sort”, “Threshold”, “2 periods of 4” and the periods; further down, “By activity” and the export. Illustration.

Which weeks were too light?

Set a km threshold: the list keeps only the periods that reach it; the chart keeps them all.

The split (1), “Min km” at 119 (2), “Export (CSV)” (3) and the sentence saying the export ignores them.

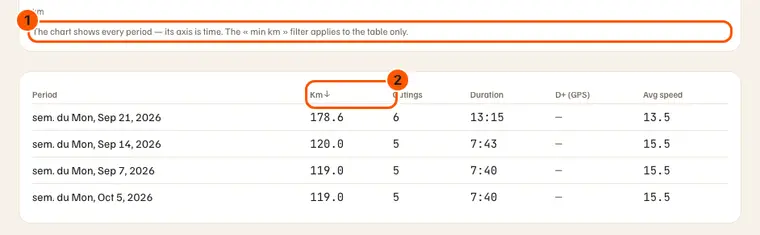
With a threshold, the chart says so (1); the list is sorted by km, largest first (2) — the 118 km week is gone.

  • Threshold: “Min km” on the site, “Threshold” on the phone. A period at the threshold stays (119 km for a threshold of 119). Empty or zero: no threshold.
  • On the phone, the count sits under the buttons: “2 periods of 4”, or “No period reaches 100 km”.
  • Sort: click a header on the site (Period, Km, Outings, Duration, D+, Avg speed); a second click reverses it. On the phone, “Sort” picks the column and Ascending or Descending.
  • To find the light weeks: sort by km ascending, with no threshold.

What counts as pulling?

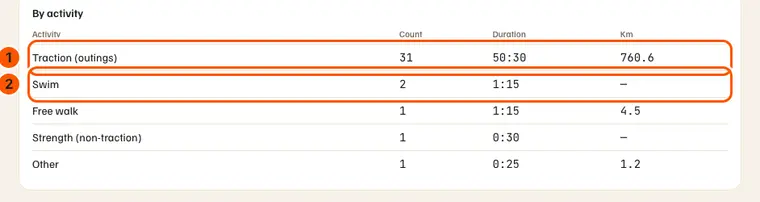
“By activity” puts pulling on one row, then each activity without pulling on its own.

“By activity”: the pulling row (1), then swimming (2) and the other activities without pulling.

  • Pulling: outings and races (“Traction (outings)” on the site, “Pulling (outings and races)” on the phone) — what the chart and the list count.
  • Without pulling: free walk, swim, strength work, bike ride… logged with “Log an outing”: count, duration, km or “—”. They never enter “Volume per period”.

Is one of my teams unbalanced?

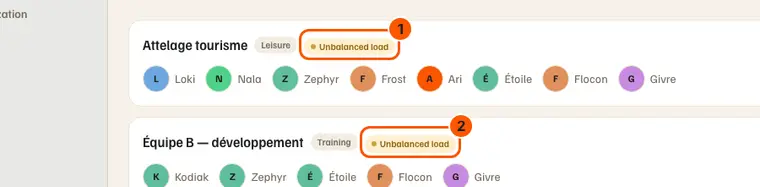
“Unbalanced load” flags a team whose season rests on one dog, or half of which stayed at the kennel.

The site's team list: “Unbalanced load” on “Attelage tourisme” (1) and on “Équipe B — développement” (2).

  • Two rules, for a team of at least two dogs: one dog carries at least 2 times the team's median km this season (“One dog carries 3.0× the team's median load this season.”); or half or more has not run (“Half or more of the team has not run this season.”).
  • Site: the chip on Kennel › Dogs › Teams; its sentence shows on hover.
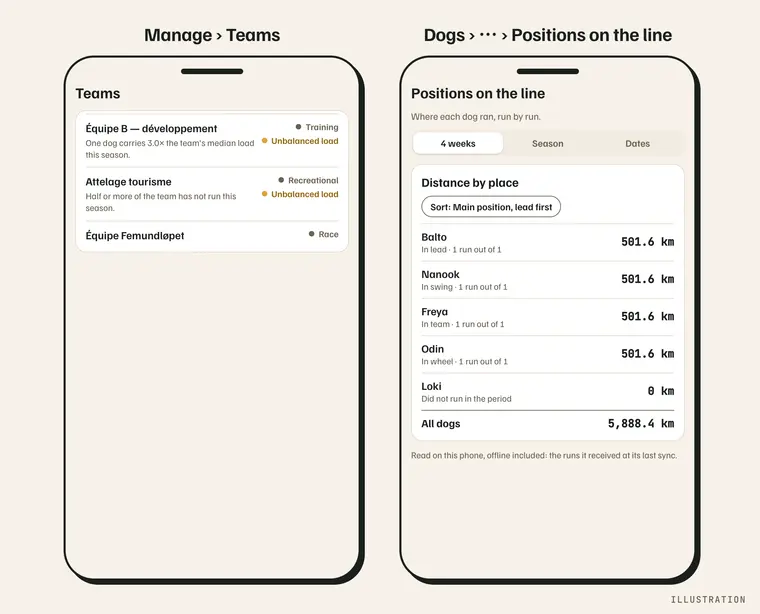
  • Phone: a banner in Statistics, one line per team, for the whole kennel — the screen's team choice does not change it; and the chip, with its sentence, in Manage › Teams.
  • What is read: the season of the current goal, its training sessions only (not races), each dog stopped at the km where it was taken off the line.

On the phone: Manage › Teams, with the chip and its sentence under the name; Dogs › ⋯ › Positions on the line. Illustration.

Who runs where on the line?

“Positions on the line”: each dog's main position, its km in each position, what happened to it.

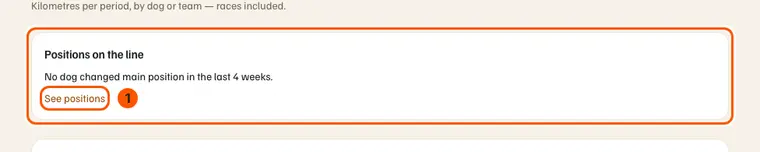
The “Positions on the line” card of the site's statistics and its “See positions” link (1).

  • Site: the card counts the dogs that changed main position in the last 4 weeks; “See positions” opens the Kennel › Positions on the line tab.
  • Phone: Dogs › “⋯” › Positions on the line, and “Position on the line” in the Training tab of a dog's record. No card in Statistics.
  • The detail (period, sort, runs, events): see Your dogs, section “Positions on the line”.

I want my figures in a spreadsheet

The export holds every period, in time order, for the team and dogs chosen.

  • Site: “Export (CSV)”, next to the threshold; the periods of the chosen split, then the activities without pulling.
  • Phone: “Export the totals (CSV)”, under “By activity”, then By week (dated by its Monday), By month or By year.
  • Sort and threshold do not apply to the file; as soon as a sort or a threshold is set, the screen says so next to the button.

What it does not do

  • The chart is never filtered by the threshold: its axis is time; only the list is.
  • The export is neither sorted nor filtered: it stays in time order.
  • A dog taken off the line counts only the km it ran until then — in the km of chosen dogs, the unbalanced load and the positions on the line.
  • The unbalanced load reads only the current goal's season and its training sessions: not races, not activities without pulling, not past seasons.
  • Statistics count, they do not predict: nothing here says whether a dog is doing too much. Each dog's form and load are read in Your dogs (section “Training”), and the plan in The training plan.

Going further

  • Your dogs — the phone's Load and Summary views, a dog's load and “Understand this number”.
  • Traces and recaps — the outings these figures add up, and “Log an outing” for an activity without pulling.
  • Settings and subscription — “Measure freshness”, read by the “Consistency and care” card at the top of the statistics.